Fibonacci retracement
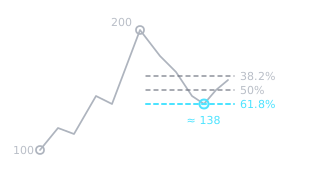
A tool that draws levels at 38.2%, 50% and 61.8% of a move between a swing low and a swing high. They show where a pullback may stop.
What it is
The Fibonacci retracement tool splits a clear price move into parts. The most used levels are 38.2%, 50% and 61.8%, less often 23.6% and 78.6%. Most come from ratios in the Fibonacci sequence. The 50% level is not a Fibonacci ratio; traders use it out of habit. The levels are not magic: they help you mark in advance the zones where a pullback often slows down.
How to draw it
- Find a clear move: an obvious swing low and an obvious swing high on the same timeframe.
- In a rising move drag the tool from the low to the high, in a falling move the other way round.
- In a rising move each level is the high minus the size of the move multiplied by 0.382, 0.5 or 0.618. In a falling move the same amount is added to the low.
- Read the levels as zones, not exact lines, and check whether they line up with support or resistance.
Real example: BTC in 2024 and 2025

On the weekly chart BTC/USDT rose from 49,000 (week of 5 August 2024) to 109,588 (week of 20 January 2025). The move was 60,588, so the 38.2% level sits at 86,443, 50% at 79,294 and 61.8% at 72,145. From late February to early April 2025, weekly candles dipped into the zone between 50% and 61.8% four times and stopped there. The lowest point, 74,508, was a retracement of about 57.9%. Price did not stop exactly on a line, so the levels work better as zones. This case does not prove the levels always work: in another move price can slice straight through.
Common mistakes
- Picking points so the levels "fit". The low and the high must be obvious, not chosen to match the answer you want.
- Drawing levels on small, noisy moves. The smaller the move, the less its levels mean.
- Treating 61.8% as guaranteed support. If price closes well below it, the structure of the move has already changed.
- Using Fibonacci on its own. The levels carry more weight when they line up with an earlier level or another tool, which is called confluence.
How to practise
On a daily or weekly chart, find ten clear moves and draw the levels on each. Note where the pullback stopped: before 38.2%, between 38.2% and 61.8%, or deeper. After ten cases you will see how the results scatter and why the levels are used together with support and resistance levels.
Frequently asked questions
Which Fibonacci level matters most?
Does Fibonacci retracement work in crypto?
Which timeframe should I use?
You can review and test yourself on these terms in the Skenuok app.