Bull and bear market
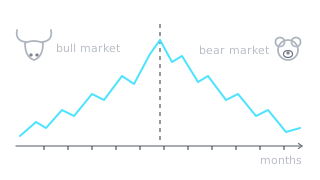
A bull market is a long stretch, months at least, when prices mostly rise and people are optimistic. A bear market is the opposite: prices fall for months and fear rules.
Where the names come from
The usual explanation: a bull attacks by thrusting its horns upward, while a bear swipes its paw downward. So a bull market means a long rise and a bear market a long decline. Traders who expect a rise or a fall are called bulls and bears too.
How to spot it on a chart
Crypto has no official threshold for when a market becomes a bear market. In practice, traders look at three things on the weekly or daily chart:
- Structure. In a bull market highs and lows keep rising; in a bear market they keep falling.
- Duration. We are talking months, not days. A few days of falling prices in a rising market is a pullback, not a bear market.
- Price and a long average. Traders often check whether price holds above a long-term moving average, such as the 200-day one.
Real example: BTC in 2021 and 2022

On 10 November 2021 BTC/USDT on Binance reached 69,000. Then for more than a year price fell with lower highs and lower lows, until it hit 15,476 on 21 November 2022. That is a drop of about 77.6% from the peak. There were strong bounces along the way: in March 2022 price rose to 48,190, and in the summer from 17,622 to 25,211, more than 40%. Both times it was only a lower high. In July 2023 price briefly reached 31,804, more than double the low.
Common mistakes
- Calling a new bull or bear market after a few days. Market phases are only clear in hindsight.
- Thinking prices only fall in a bear market. As summer 2022 shows, bounces can reach tens of percent.
- Going against the main trend just because price "has fallen too far" or "risen too much". Price can keep moving the same way far longer than seems logical.
- Confusing the phase of the whole market with one coin. Even in a bull market some coins fall.
How to practise
Open the BTC weekly chart from 2017 and mark the long rising and falling phases: where they started, where they ended and how long they lasted. Then do the same on the daily chart and see how many pullbacks fit inside one phase. In the Skenuok app, the daily market context describes the overall market backdrop every day. More on reading charts: Technical analysis for crypto.
Frequently asked questions
How long does a bear market last?
How is a bull market different from a bounce?
What is a sideways market?
You can review and test yourself on these terms in the Skenuok app.