Moving average (MA, SMA, EMA)
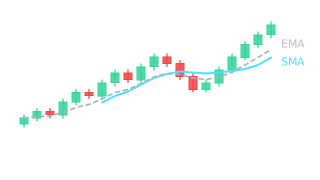
A moving average is the average price over a chosen number of periods, drawn as a line on the chart. SMA weights all candles equally, EMA gives more weight to the latest ones.
How it is calculated
A simple moving average (SMA) adds up the closing prices of the last N candles and divides by N. When a new candle appears, the oldest drops out, so the average "moves" with the chart. An exponential average (EMA) gives more weight to the latest candles, so it reacts to changes faster.
The most common periods are 20 (short trend), 50 (medium) and 200 (long). On a daily chart 50 means 50 days, on an hourly chart 50 hours.
What it is used for
- Trend direction: when the average rises and price holds above it, the trend is up.
- Moving support or resistance: in a trend, price often pulls back to the average and bounces off it.
- Crossovers: when the 50 day average crosses above the 200 day average it is a golden cross, when it crosses below, a death cross.
Real example: BTC and the 50 day average in 2025
In mid-April 2025 BTC/USDT hovered around the 50 day SMA for several days, and on 22 April it closed well above it at 93,443. Within a month price rose to 111,980. On 5 June price dipped right to the average (low 100,372) and bounced. From 20 to 22 June it closed below the average for three days, but on 23 June it was back above. The lesson: an average is a zone, not an exact line.
On the same chart a golden cross formed on 22 May. That day price reached 111,980 and did not go higher until 9 July. Averages lag, so the cross often appears after a large part of the move has already happened.

Common mistakes
- Expecting price to bounce exactly off the line. It often pokes through the average briefly and comes back.
- Using an average in a sideways market. When price moves sideways it keeps crossing the average, and those crosses mean nothing.
- Loading five averages onto one chart. More lines do not mean more information.
How to practise
Add a 50 day SMA to the BTC and ETH daily charts. Find periods when price held above it and count how many times it touched the average and bounced, and how many times it broke through. Then compare SMA and EMA with the same period. How averages work with horizontal levels is covered in Support and resistance.
Frequently asked questions
What is the difference between SMA and EMA?
Which moving average is used most?
What are the golden cross and the death cross?
You can review and test yourself on these terms in the Skenuok app.