MACD
MACD (Moving Average Convergence Divergence) is a momentum indicator built from the difference between two moving averages. It has the MACD line, a slower signal line and bars (the histogram) showing the gap between them.
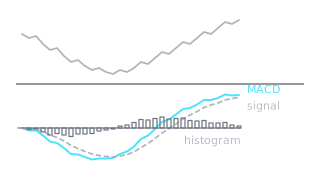
What MACD is made of
Gerald Appel created the indicator in the late 1970s. The standard setting is 12, 26, 9:
- MACD line: the 12 period exponential moving average (EMA) minus the 26 period EMA.
- Signal line: a 9 period EMA of the MACD line. It is slower and smoother.
- Histogram: bars showing the distance between the MACD line and the signal line.
How traders read it
- Crossover: when the MACD line crosses above the signal line, momentum turns up; when it crosses below, down. More in crossover.
- Zero line: MACD above zero means the faster average is above the slower one.
- Shrinking histogram: the bars get shorter, so momentum is fading even if price still moves the same way.
Real example: ETH in spring and summer 2025
On 9 April 2025 ETH/USDT fell to 1,385. The MACD line crossed above the signal line only on 14 April, with price around 1,624: the indicator lagged by five days because it is built from averages. A rise to 2,738 followed on 13 May. From 10 June to 2 July price swung between 2,112 and 2,879 with no clear direction, and the lines crossed five times in that period. In a market like that, crossovers are often false.

Common mistakes
- Treating every crossover as a trade signal. In a sideways market there are many, and most mean nothing.
- Forgetting the lag. MACD is built from averages, so it reacts after price has already moved. See lagging indicators.
- Comparing MACD values between coins. MACD is measured in price units, so the numbers for BTC and a cheap coin cannot be compared.
- Looking only at MACD and ignoring price structure. A crossover with price sitting right under strong resistance means something quite different from one after a breakout.
How to practise
Pick one coin and the daily chart. Mark every MACD crossover over the last six months and note whether the market had a clear trend or was moving sideways at the time. Mark crossovers above and below the zero line separately. You will quickly see where the indicator helps and where it is only noise. How indicators fit with patterns is covered in Chart patterns.
Frequently asked questions
What do the MACD settings 12, 26, 9 mean?
Does MACD work for crypto?
What is MACD divergence?
You can review and test yourself on these terms in the Skenuok app.