RSI (Relative Strength Index)
RSI (Relative Strength Index) is an oscillator from 0 to 100 that shows the strength of price moves. It is usually calculated from 14 candles: above 70 is considered overbought, below 30 oversold.
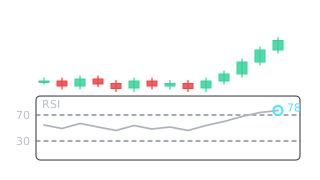
How RSI is calculated
RSI was described by J. Welles Wilder in 1978. It compares the average gain with the average loss over a chosen period, most often 14 candles. If price mostly rose during that time, RSI moves towards 100; if it mostly fell, towards 0. A reading around 50 means gains and losses are roughly balanced.
RSI does not show price, it shows the strength of the move, and it swings between 0 and 100. That is why it counts as an oscillator and is usually drawn in a separate panel below the price chart.
What 70 and 30 mean
- Above 70: price has risen fast and the zone is called overbought. It warns that the move is stretched, it is not a command to sell.
- Below 30: price has fallen fast and the zone is called oversold. A bounce is possible but not guaranteed.
- Around 50: balance. In an uptrend RSI often stays above 50, in a downtrend below it.
Real example: BTC in November 2024
On 6 November 2024 the daily RSI of BTC/USDT rose above 70 as price closed at 75,572. Anyone reading that as a sign the rally was over would have been wrong: RSI stayed above 70 for almost three weeks, and on 22 November price reached 99,588. In a strong trend, overbought can last a long time.

Common mistakes
- Selling only because RSI is above 70, or buying only because it is below 30. One indicator without context is too weak a basis.
- Ignoring the trend. In a rising market RSI sits high more often, in a falling one low.
- Mixing timeframes. The 15 minute RSI and the daily RSI can say opposite things.
- Changing the period until the indicator "confirms" a decision you have already made.
How to practise
Open the daily BTC chart and find five places where RSI crossed 70 or 30. For each, note what price did after 5 and after 20 candles. Then look for divergences: price makes a new high while RSI does not. How RSI fits with levels and structure is covered in Technical analysis for crypto.
Frequently asked questions
Which RSI setting is most common?
Does RSI above 70 mean price will fall?
How is RSI different from MACD?
You can review and test yourself on these terms in the Skenuok app.