Trading volume
Trading volume is how many coins were bought and sold over a period. On a chart it shows as bars along the bottom: a tall bar means a lot of trading.
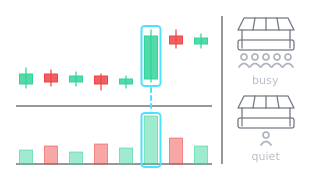
What it is
Every trade has a buyer and a seller, so volume does not tell you which side was bigger. It tells you how much trading happened: how many coins changed hands during one candle. Exchanges often show two numbers: volume in coins, such as BTC, and its value in the quote currency, such as USDT.
How to read it
Volume matters less on its own than compared with what is normal. That is why traders often check whether a bar is taller than the average of the last 20 candles. A price move on high volume shows that many market participants took part. A move on low volume is more often short-lived, though not always.
- A breakout on high volume is usually seen as more reliable than a quiet one.
- A long wick on very high volume shows that a lot of buyers and sellers met at that level.
- Falling volume while price rises shows that fewer and fewer participants are backing the move.
Real example: ETH on 20 May 2024

That day ETH/USDT on Binance rose from 3,071 to 3,662, more than 19%. Volume reached about 847k ETH, roughly 2.8 times the 20-day average of about 303k ETH. On two of the next three days, volume was again about 3 times the average. After that it went back to normal, and price stalled between 3,700 and 3,980 for almost two weeks. By the end of June ETH was back around 3,400. High volume showed a strong move, but it did not say how long the move would last.
Common mistakes
- Reading volume without context. Weekends are often quieter, so the same bar means different things on a Saturday and on a Tuesday.
- Thinking volume shows direction. It shows activity. Direction comes from the candles and the market structure.
- Comparing volume across exchanges. Each exchange shows only its own trades, so the numbers differ.
- Trusting small-coin volume blindly. When liquidity is thin, a few large trades can distort the picture.
How to practise
Open the daily chart of any coin and find the five tallest volume bars of the past year. Next to each, note what price was doing at the time: a breakout, a sharp drop or a reversal. Then look at the next five candles. You will see that volume helps you judge how strong a move is, but it does not predict the future. More on reading charts in Technical analysis for crypto.
Frequently asked questions
What counts as high volume?
Does high volume mean price will rise?
Why does volume differ between websites?
You can review and test yourself on these terms in the Skenuok app.