Breakout
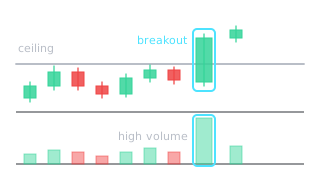
Price convincingly moves above resistance or below support and closes there. A stronger breakout comes with higher volume.
What it is
When price fails to get past the same level again and again, resistance or support forms. A breakout happens when a candle closes beyond that level. The close is what counts: a wick that only pokes through is not yet a breakout. Breakouts can go up or down.
How to confirm it
- A close beyond the level on the timeframe where the level was drawn, for example daily or 4-hour.
- Higher volume than usual: it shows that many participants are behind the move.
- A retest: price comes back to the broken level and it holds from the other side.
- The higher-timeframe direction: a breakout in the direction of the main trend is seen as more reliable.
Real example: BTC in October 2023

In late June and July 2023 BTC/USDT rose into the 31,000-31,804 zone several times but never closed above it. On 13 July a wick reached 31,804 and the day closed at 31,454. On 23 October the daily candle closed at 33,070, clearly above the zone, on volume about 3 times the 20-day average. The next day volume was again more than 3 times the average and price reached 35,280. A breakout does not guarantee follow-through, which is why traders who enter after an upside breakout often plan their stop below the broken level.
Common mistakes
- Jumping in when a wick barely crosses the level. If the candle closes back inside, it is a false breakout (fakeout).
- Ignoring volume. A breakout on low volume is considered weaker.
- Chasing price far from the level. The further from the broken level you enter, the further away the stop and the worse the risk to reward.
- Drawing a level through one random wick. Meaningful levels get touched several times.
How to practise
On a daily chart, find ten clear levels that price touched at least twice. For each, note what happened the first time a candle closed beyond it: did price follow through or come back? Write the volume next to it. You will see which features go with breakouts that hold. The Skenuok app has more real examples in its pattern library built on real Binance charts. More in Support and resistance levels and Chart patterns.
Frequently asked questions
How is a breakout different from a false breakout?
Which timeframe should confirm a breakout?
Does price always come back to retest the level?
You can review and test yourself on these terms in the Skenuok app.