Risk to reward (R:R)
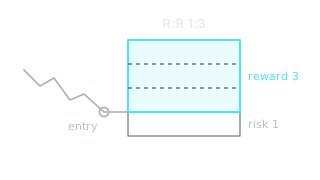
How much you can lose compared with how much you aim to gain: R:R 1:3 means you risk 1 to make 3. The higher the ratio, the lower the win rate you need to avoid a loss overall.
How to calculate it
The risk to reward ratio (R:R) is worked out from three prices: the entry, the stop loss and the target. Risk is the distance from entry to stop; potential reward is the distance from entry to target.
Example: entry 100, stop 98, target 106. The risk is 2 and the potential reward is 6, so R:R is 1:3. Traders often call this "3R": the target is three times as far away as the stop.
The link to win rate
The ratio promises nothing on its own. It matters together with the share of trades that reach the target. If every trade ends either at the stop or at the target, the break-even win rate is 1 / (1 + R), where R is reward divided by risk, for example 2 when R:R is 1:2. At 1:2 the target has to be hit in more than a third of trades. Add trading fees and slippage on top, so the real threshold is a little higher.
| R:R | Win rate needed to break even (before fees) |
|---|---|
| 1:1 | 50% |
| 1:2 | 33.3% |
| 1:3 | 25% |
| 1:4 | 20% |
What it looks like in the app
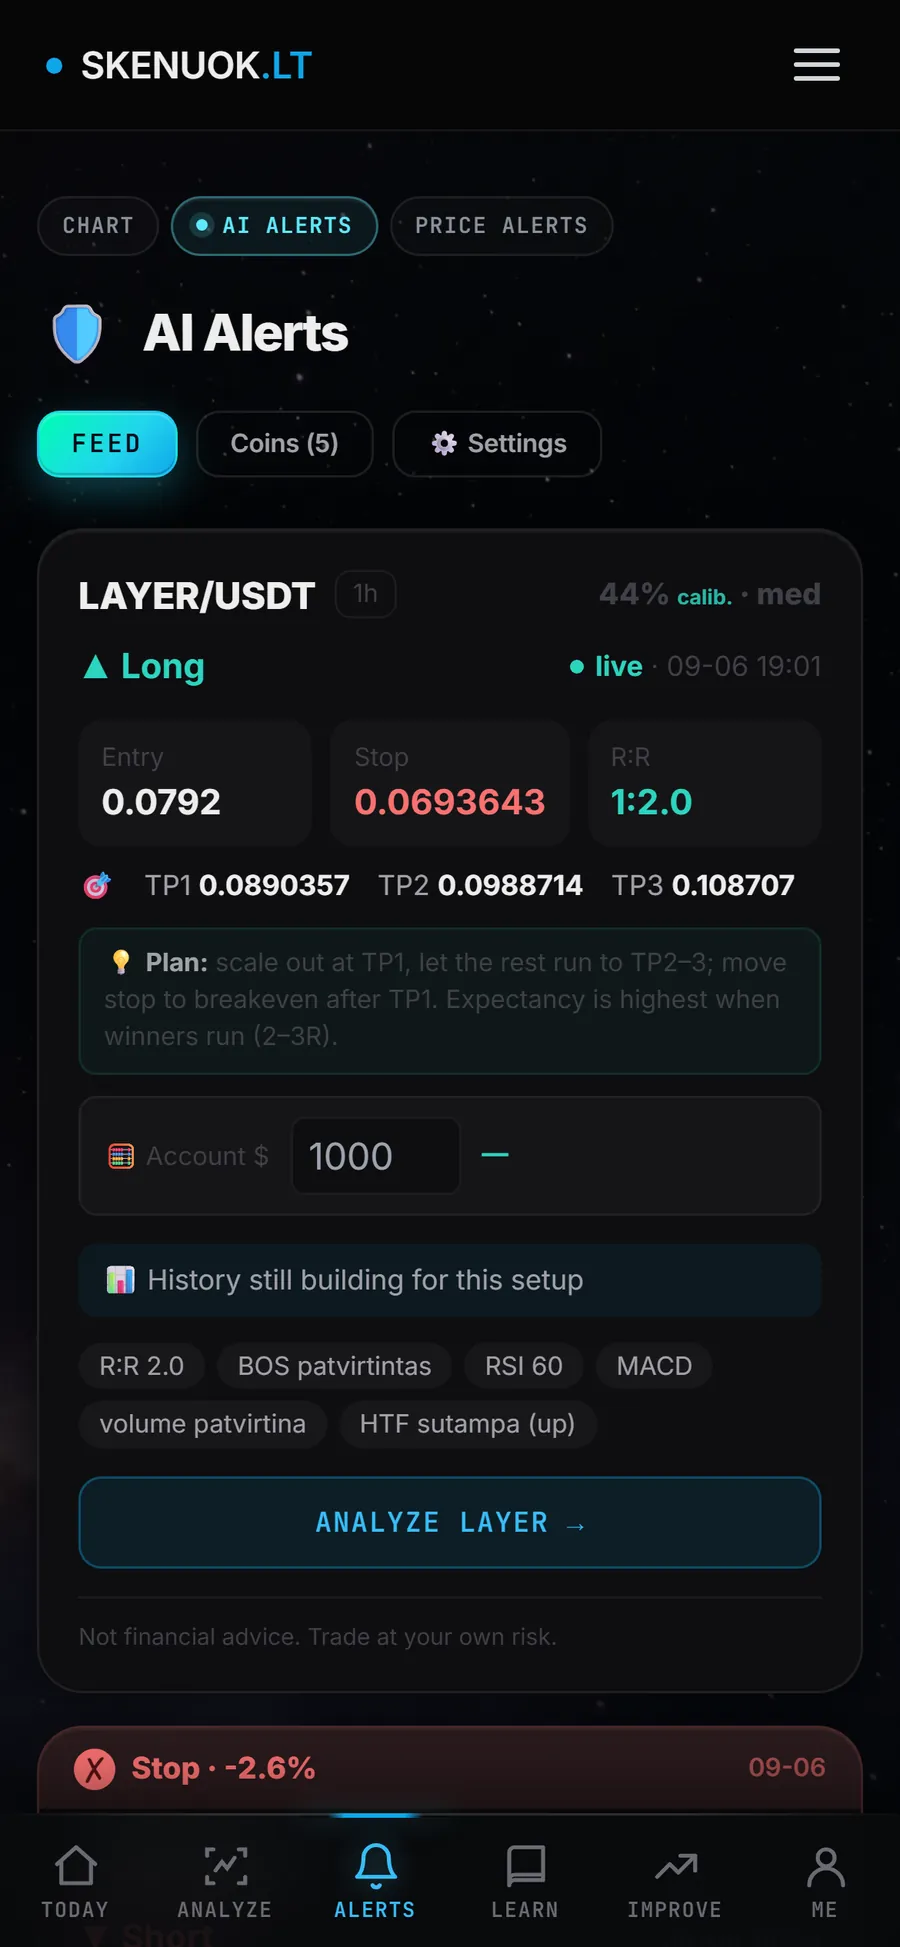
On this screen the risk per LAYER unit is about 0.0098: 0.0792 minus 0.0694. TP1 sits one such distance away, TP2 two and TP3 three, so the ratio to TP2 is 1:2. You can apply the same logic to any plan of your own.
Common mistakes
- Stretching the target so the ratio looks good. The target must come from a level on the chart, not from the number you want.
- Placing the stop too tight. It improves R:R only on paper, because normal noise often hits it.
- Looking at R:R alone. A 1:5 ratio is worthless if the target is almost never reached.
- Moving the stop further away when price goes against you. Your real risk then becomes bigger than planned.
How to practise
Before every practice decision, write down the entry, stop, target and R:R, and afterwards the result in R: a loss of 1R, a gain of 2R and so on. After 30 entries you will see your real win rate and average result. In the Skenuok app, Decision modes and the decision journal are built for this, with no real money involved. More in Risk management and stop loss.
Frequently asked questions
What is a good R:R?
How is R:R different from win rate?
Is R:R calculated differently with leverage?
You can review and test yourself on these terms in the Skenuok app.