Risk management in trading: where to place a stop loss and how to calculate position size
Risk management in trading starts not with how much you will make, but with how much you will lose if you are wrong. This article shows, step by step, how to set your risk per trade, where to place a stop loss order and how to calculate position size with a simple formula. The examples use simple numbers and real BTC/USDT charts from Binance.
What is risk management in trading?
Risk management is a set of rules that decides, before you enter a trade, how much money you can lose if the price moves against you. It does not tell you where the price will go. It tells you what happens to your account when you are wrong. And you will be wrong often.
Experienced traders have losing trades too. The difference is that their losses are usually small and planned in advance. That is why it pays to learn risk management before any indicator. You will find the basics of reading charts in our guide to crypto technical analysis.
In practice, four questions are answered before every trade:
- What percentage of my account am I risking? Most often 0.5-2%.
- Where does my idea stop being valid? That is where the stop goes.
- What is my position size? It is calculated from the first two answers.
- Is the target far enough away? The risk to reward ratio tells you.
How much to risk per trade: the 1-2% rule
Risk per trade is the amount you will lose if your stop is hit, expressed as a percentage of your account. It is not the position size. If your account holds 2,000 USDT and you risk 1%, you lose about 20 USDT when the stop is hit, even though the position itself may be worth 400 or 1,000 USDT.
Trading textbooks and courses most often mention a 1-2% limit, and beginners often choose 0.5-1%. What matters most is that the limit stays fixed and is set in advance, not made up after three losses in a row.
Why this much: the math of losing streaks
Losses often come in streaks. The table shows what is left of an account after ten losing trades in a row and how much you then need to gain to get back to where you started. Each time, the risk is calculated from the balance at that moment.
| Risk per trade | Account balance after 10 losses | Drawdown | Gain needed to recover |
|---|---|---|---|
| 1% | 90.4% | 9.6% | 10.6% |
| 2% | 81.7% | 18.3% | 22.4% |
| 5% | 59.9% | 40.1% | 67.0% |
| 10% | 34.9% | 65.1% | 186.8% |
With 1% risk, ten losses in a row are unpleasant but not dangerous for the account. With 10% risk, a third of the account is left, and to recover you would need to almost triple the balance. A fall like this from the account's peak is called a drawdown.
Is a long losing streak realistic? If you win 40% of your trades and they are independent of each other, the chance of hitting at least one streak of 5 or more losses in a row within 100 trades is about 98%, and of 8 or more in a row about 49%. That is simple probability, not exceptional bad luck.
The EU financial supervisors warn that the price of most crypto assets can fall and rise quickly over short periods of time, and that you may lose a lot, or even all, of the money invested (ESMA, EBA and EIOPA warning). A small risk per trade keeps you in the market long enough to learn.
Stop loss: what it is and why you need one
A stop loss order, or simply a stop, is an order you place on the exchange in advance that closes your position when the price reaches the level you set. The crypto market runs around the clock, so a stop limits your loss even while you sleep.
Without a stop, the size of your loss depends on when you decide to close the position, and decisions made under stress are often poor ones.
A real chart: what would have happened without a stop in late January 2026

From late November 2025 to late January 2026, BTC moved sideways, with a support zone around 83,500-84,500 at the bottom of the range. The lowest point of the range was the November 21 low at 80,600. Suppose that on January 29, when price came back into the zone, a trader opened a buy position (long) at 84,000. The idea is simple: buyers are defending this zone. If price fell below the 80,600 low, the idea would no longer hold, so the stop goes slightly below it, at 79,800. That is about 5% from the entry.
On January 31, price broke through that low: the daily low was 75,720 and the candle closed at 78,741. The stop would have been hit that same day and closed the position at a loss of about 5%, perhaps slightly more because of slippage. Without a stop, the same position would have been about 28.6% down on February 6, when price fell to 60,000.
With a 2,000 USDT account and 1% risk, this position would be about 400 USDT, and the loss when the stop was hit about 20 USDT. If the whole account had gone in without a stop, the loss at 60,000 would have reached about 571 USDT. The analysis is the same in both cases. Only the risk management is different.
Where to place a stop loss: the invalidation point, not a random percentage
One of the most common beginner mistakes is a stop set by feel: 2% or 5% from the entry, because it is convenient. The market does not care about your entry price. The stop belongs where the chart proves your idea wrong. This is called the invalidation point.
- For a long position, the stop usually goes below the last significant low or support zone. If price closes below them, buyers failed to defend the level.
- For a sell (short) position, it is the opposite: above the last significant high or resistance zone.
- With a buffer. Price often pokes through a level briefly with a wick. Some traders size the buffer with ATR, for example half of the daily ATR beyond the level.
- Not where it is obvious to everyone. Many stops tend to pile up right below a clear low or at a round number such as 75,000, so price often dips there briefly and comes back (a stop hunt).
- If the stop is too far away, the answer is not to move it closer but to reduce the position or skip the trade.
How to find these zones is explained in our article on support and resistance levels.
Example: a 2% stop vs a stop beyond the structure

In late August and September 2026, BTC was moving sideways again. Lows kept forming in a zone around 75,500-76,900, and the lowest one came on August 23 at 75,546. Suppose a long position was opened at the September 9 daily close, about 78,300.
A random 2% stop would sit at 76,734, in the upper part of the zone of lows, where price keeps swinging back and forth. The very next day, September 10, price dropped to 76,464 and that stop would have been hit.
A stop beyond the structure goes below the August 23 low with a buffer of about half the daily ATR (ATR was about 2,230 at the time), which puts it around 74,400. On September 15, price briefly fell to 74,968, below the 75,546 low and the round 75,000, but the day closed at 75,644, back above the low. On a daily closing basis the structure did not break, and the stop beyond it was never touched.
This example does not show that a stop beyond the structure always “wins”. In the January example the level broke and the stop would have been hit, exactly as it should. Both examples show the same thing: the chart decides where the stop goes, not a convenient percentage.
In the Skenuok app, the AI chart scanner's plan gives an invalidation rule next to the entry, stop and targets T1-T3: the condition that proves the idea wrong.
Position size: the formula and a worked example
Once you know your risk and where the stop goes, calculating position size is simple:
- Risk in money = account size × risk percentage.
- Quantity = risk in money ÷ distance to the stop (the difference between the entry and stop prices).
- Position value = quantity × entry price, or risk in money ÷ stop distance in percent (5% = 0.05).
A worked example
The September example from the chart above:
- Account 2,000 USDT, risk 1%: the risk in money is 20 USDT.
- Entry 78,300, stop 74,400: the distance is 3,900 USDT per BTC, or about 5%.
- Quantity: 20 ÷ 3,900 ≈ 0.00513 BTC.
- Position value: 0.00513 × 78,300 ≈ 402 USDT, or about 20% of the account.
- If the stop is hit, the loss will be about 20 USDT, not counting exchange fees and possible slippage.
With the 2% stop (76,734), the same formula would give a position of about 1,000 USDT, and the loss when the stop is hit would again be 20 USDT. The stop distance changes the position size, not the risk. The table shows the same 20 USDT risk (2,000 USDT account, 1%) with different stops.
| Stop distance from entry | Position value | Share of account | Loss if the stop is hit |
|---|---|---|---|
| 1% | 2,000 USDT | 100% | 20 USDT |
| 2% | 1,000 USDT | 50% | 20 USDT |
| 5% | 400 USDT | 20% | 20 USDT |
| 10% | 200 USDT | 10% | 20 USDT |
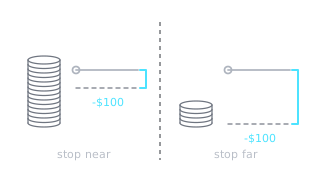
At 1% risk, a stop closer than 1% would mean a position larger than your whole account, and you would need leverage. Leverage does not by itself change the loss when the stop is hit, but it adds liquidation risk and funding fees. More on this in our article on leverage and futures.
What this looks like in the app: an AI Alert example
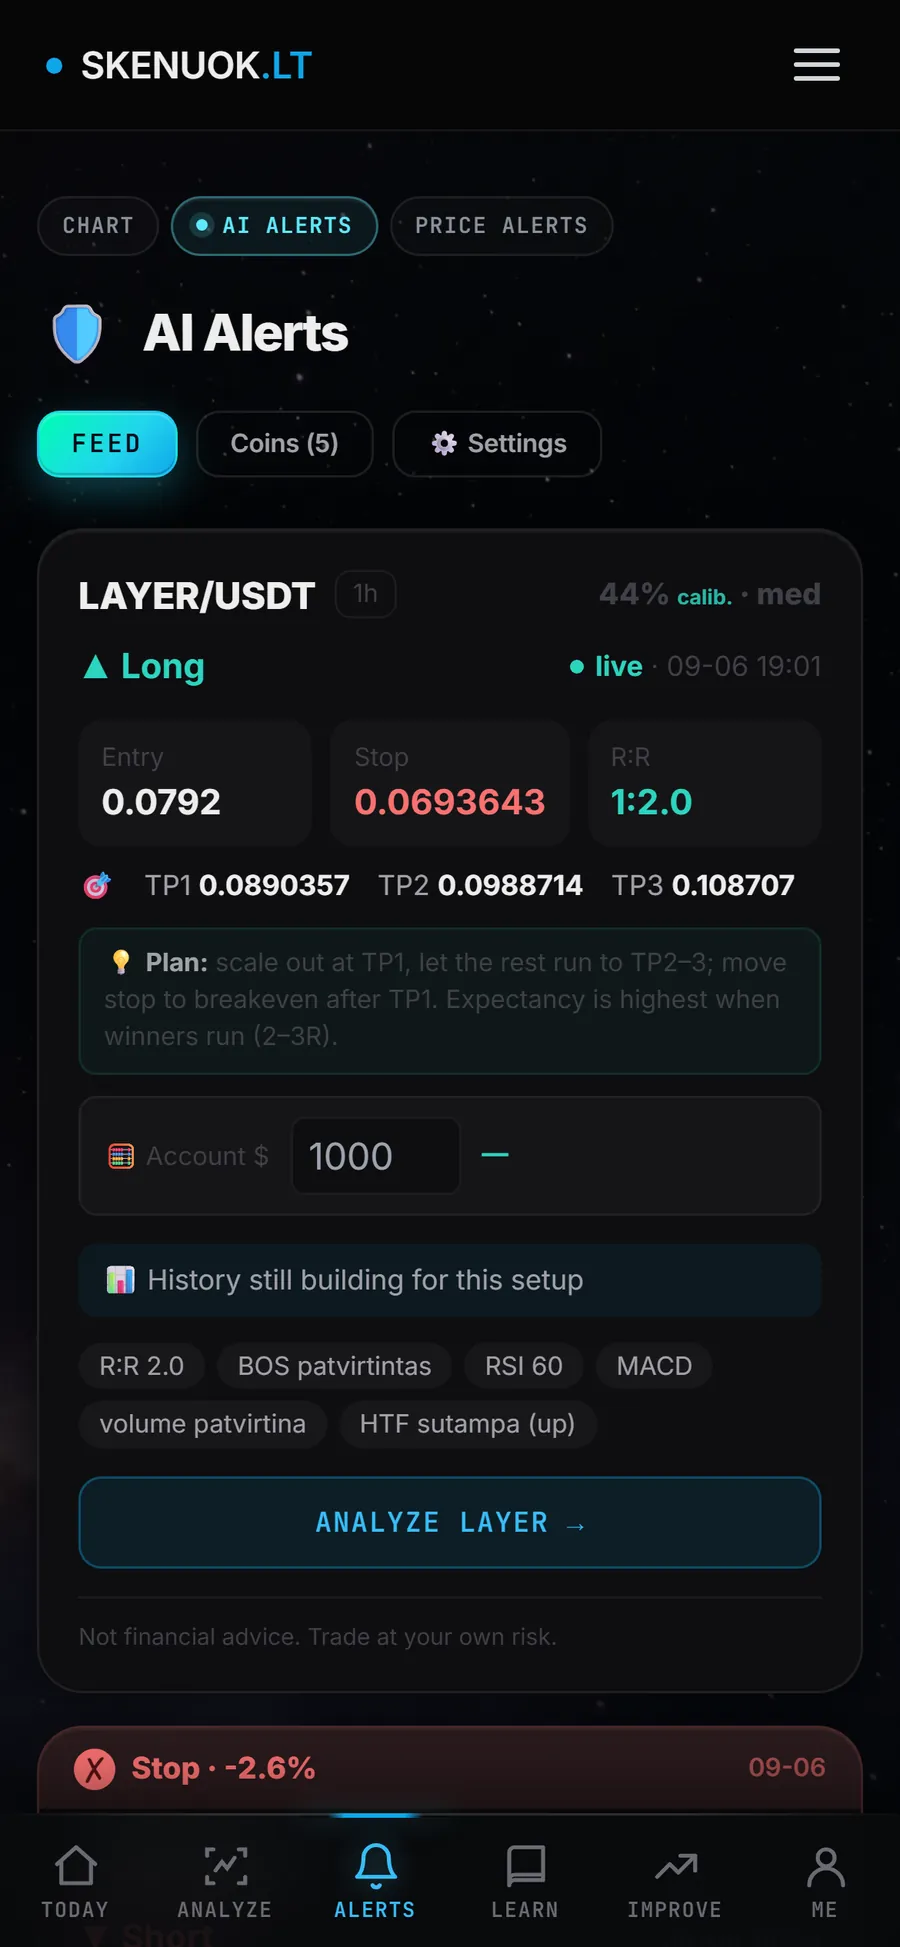
Next to the entry, stop and targets, a Skenuok AI Alert has a position-size calculator: you enter your account size. On the LAYER/USDT screen the entry is 0.0792 and the stop is 0.0693643, so the distance to the stop is about 12.4%.
Let us check it by hand. With a 1,000 USD account and 1% risk (10 USD), the position value would be 10 ÷ 0.124 ≈ 80 USD, roughly 1,017 LAYER. A wide stop means a small position.
Risk to reward ratio (R:R)
The risk to reward ratio, also written as risk/reward or R:R, compares the distance to the stop with the distance to the target. If you risk 1 to make 2, the ratio is 1:2.
In the September example, the top of the range was the September 3 high at 82,300. With the entry at 78,300 and the stop at 74,400, the risk is 3,900 and the distance to the top of the range about 4,000. That is a ratio of roughly 1:1. Many traders would skip such a trade or wait for price to come closer to support: with an entry at 76,600 the risk would be 2,200 and the potential profit up to 82,300 about 5,700, a ratio of about 1:2.6.
The ratio shows what share of your trades you need to win to avoid ending up in the red over time (not counting fees):
| Risk to reward ratio | You need to win more than |
|---|---|
| 1:1 | 50% of trades |
| 1:1.5 | 40% of trades |
| 1:2 | 33.3% of trades |
| 1:3 | 25% of trades |
The formula is simple: 1 ÷ (1 + R), where R is the potential profit in units of risk. But a distant target is not better in itself: the farther away the target, the less often price reaches it. The target (take profit) should sit at a real level on the chart, not wherever the ratio looks good.
Why win rate alone tells you nothing
Win rate shows how often a trade ends in profit. It does not tell you how much you make when you win and how much you lose when you lose. That is why the claim “I win 70% of my trades” means nothing without other data.
Let us compare two traders who each make 10 trades and risk one unit of risk on each:
- Trader A wins 7 out of 10 but takes profit too early: an average win brings 0.3 units, while each loss costs the full unit. In total that is 2.1 units of profit and 3 units of loss, so the result is 0.9 units in the red.
- Trader B wins only 4 out of 10, but an average win brings 2 units. In total that is 8 units of profit and 6 units of loss, so the result is 2 units in the green.
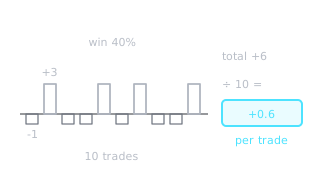
The average result per trade is called expected value (expectancy). For trader A it is 0.09 units in the red, and for trader B 0.2 units in the green. The formula: win rate × average win, minus loss rate × average loss. The illustration shows the same calculation with a 40% win rate and a 1:3 ratio.
Why does this happen? It is tempting to lock in a profit quickly and hold on to a losing position, hoping the price will come back. Behavioural finance research calls this the disposition effect (Odean, 1998). Risk management helps break the habit: the stop and the target are set before the trade, not during it.
Also, 10 or 20 trades is too small a sample, and past results do not guarantee future results.
Trading journal: how to see your real risk
Memory is selective: you remember your wins vividly and explain your mistakes away. A trading journal shows what you actually do. A simple spreadsheet or notes are enough.
For each trade, it is worth writing down:
- the date, the pair and the timeframe;
- the entry, stop and target, written down before you open the position;
- the risk in percent and the position size;
- the reason: which level or pattern you saw;
- the result in units of risk, for example a loss of 1 unit or a profit of 2 units;
- whether you followed the plan and how you felt before the trade.
Once a week, go through your entries. Look for patterns, not profit: do you move your stop, do you increase your position after a loss, do you trade out of boredom? Some traders also set a daily loss limit: after a few stops are hit, they stop trading for the day.
In the Skenuok app you can mark the outcome of a scan (won, lost, skipped) and see your statistics, and the training section has a decision journal and weak-spot diagnostics. If you are just starting out, you will find a step-by-step plan in our article on how to start trading crypto.
Frequently asked questions
What is a stop loss in simple terms?
How much of their account do traders usually risk per trade?
How do you calculate position size?
Does a stop loss always fill at the exact price you set?
Can you move a stop loss?
You can practise this on real charts in the app: the scanner plan and AI Alerts show the entry, stop and targets, and AI Alerts include a position-size calculator for your account.